
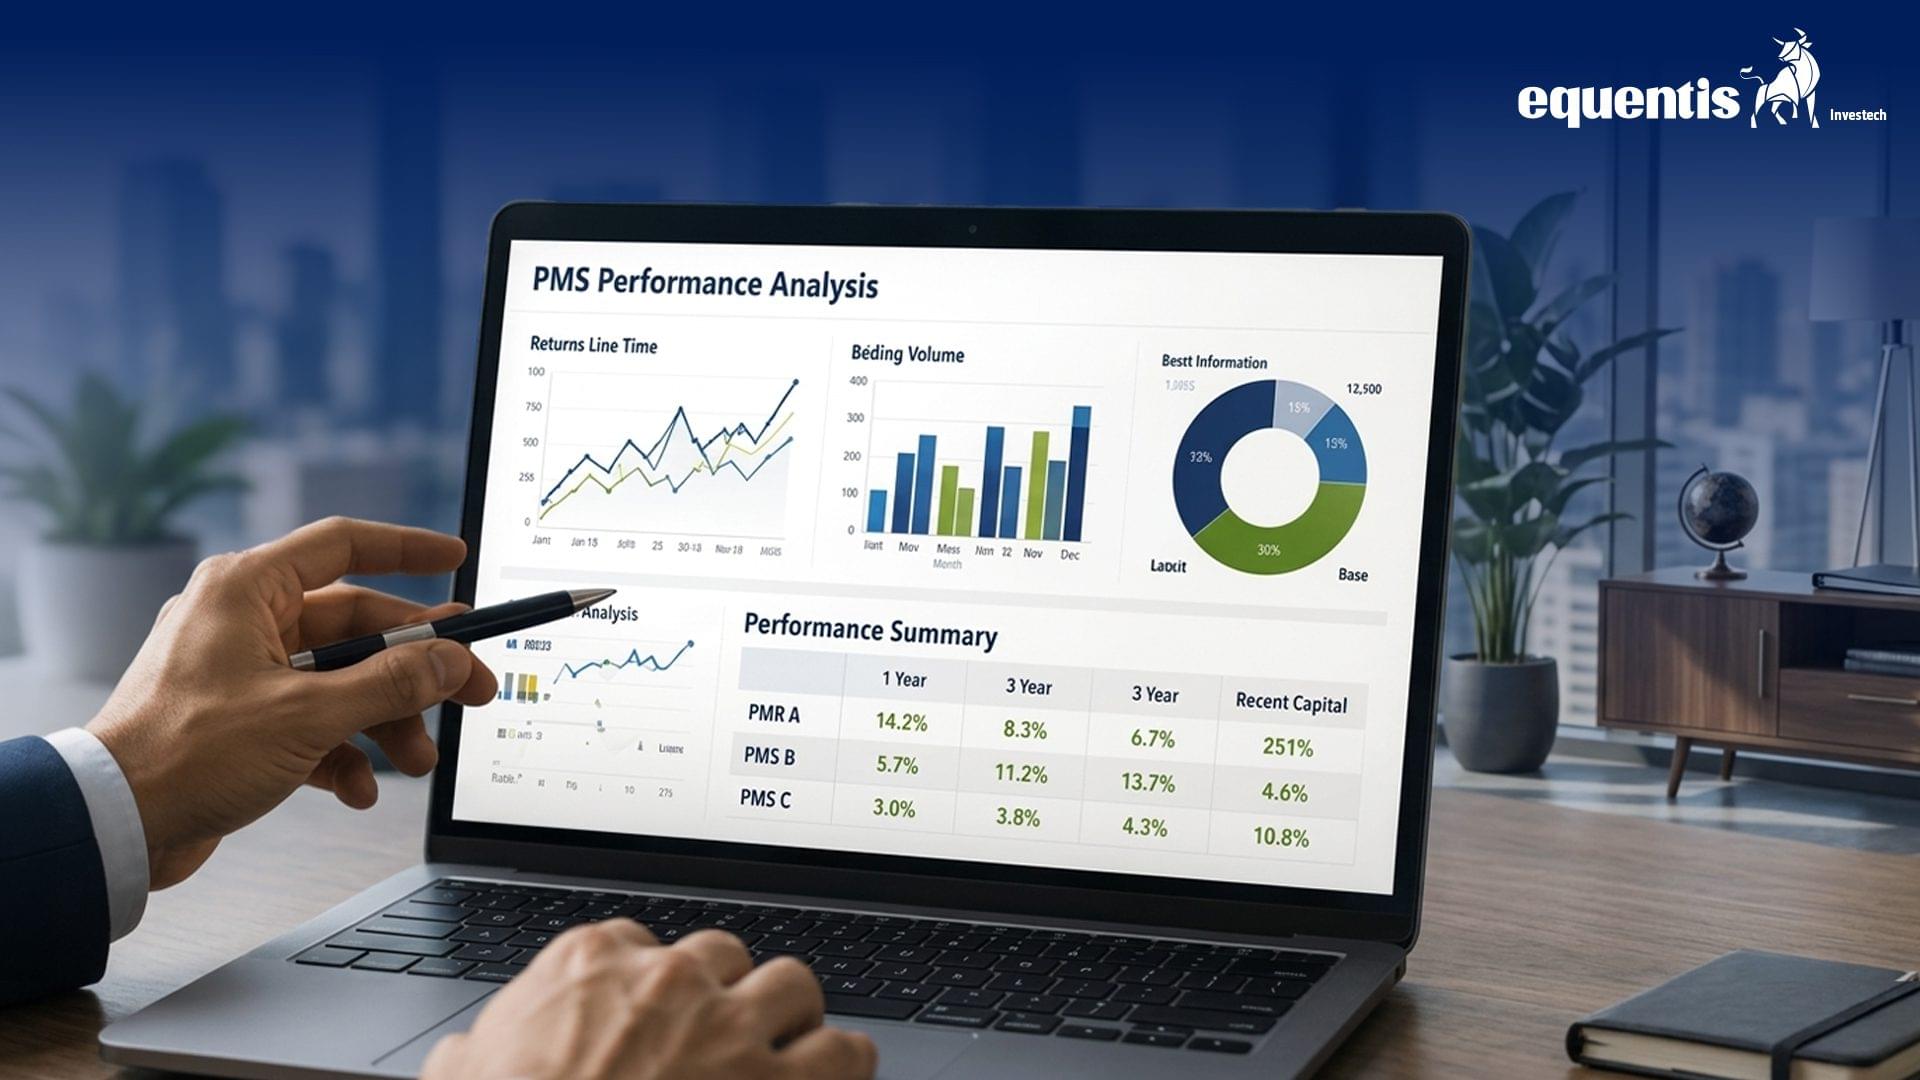
When investors compare two Portfolio Management Services, or PMS strategies, the first number they often look at is the return.
It is understandable. Returns are easy to compare, easy to communicate and often the first metric highlighted in performance discussions. But looking only at past returns can leave out some of the most important differences between two PMS strategies.
Two strategies can generate similar returns while taking very different levels of risk. One may be concentrated in a handful of stocks, while another may hold a much broader portfolio. One may focus on large companies, while another may invest heavily in mid and small caps. Their investment horizons, portfolio turnover, cash levels, fees and approaches to risk management may also be very different.
This is why comparing PMS strategies requires looking beyond the headline return.
Here are some of the key factors investors can examine.
Start With the Investment Philosophy
Before looking at performance numbers, understand how the PMS actually invests.
Does the strategy focus on growth companies, value opportunities, quality businesses, special situations or a particular sector or market segment?
The investment philosophy provides context for everything else.
For example, a strategy that invests in companies with high growth expectations may behave very differently from one that looks for undervalued businesses. Neither approach guarantees a particular outcome, but understanding the philosophy can help investors assess whether the strategy is consistent with their own investment objectives.
It is also worth checking whether the stated philosophy is reflected in the actual portfolio.
A strategy’s presentation may describe one approach while its portfolio composition reveals significant exposure to another.
Look at Risk Alongside Returns
A return number does not tell you how much risk was taken to achieve it.
Suppose PMS Strategy A generated a 20% return over a particular period, while Strategy B generated 16%.
That difference alone does not tell you which portfolio experienced the larger drawdown, held more concentrated positions or experienced greater volatility.
Investors should therefore examine risk metrics alongside returns.
Maximum drawdown can show how much the portfolio fell from a peak during a period. Volatility can provide information about fluctuations in portfolio value. Other risk measures can provide additional context depending on the strategy and available disclosures.
The objective is not to find the strategy with the lowest possible risk. Instead, it is to understand the relationship between the returns generated and the risks taken.
Understand Maximum Drawdown
Maximum drawdown deserves particular attention because investors experience losses differently from fluctuations around an average return.
Imagine a portfolio that rises significantly but experiences a 30% decline along the way.
An investor needs to be comfortable with that level of decline before committing capital to the strategy.
Looking at maximum drawdown alongside performance can provide a better picture of the investment experience than annual returns alone.
It can also help investors understand how the strategy behaved during difficult market conditions.
A strategy’s ability to recover after a drawdown is another useful part of the historical picture, although past recovery does not guarantee similar outcomes in the future.
Examine Portfolio Concentration
The number of stocks in a portfolio can tell you something about how concentrated the strategy is.
A portfolio holding 15 companies can behave very differently from one holding 50 companies.
In a concentrated strategy, a small number of positions may have a significant impact on overall performance. A successful investment can contribute meaningfully to returns, but a large decline in one position can also affect the portfolio substantially.
Investors should look at the allocation to the top holdings rather than simply counting the number of stocks.
For example, a portfolio with 30 stocks could still have a large percentage of its capital invested in its top five holdings.
Understanding concentration helps investors understand where the portfolio’s performance is coming from and how dependent it may be on a small number of investments.
Check Sector and Market-Cap Exposure
Two PMS strategies can have completely different portfolios even if their historical returns look similar.
One might have substantial exposure to financial services and technology, while another may have greater exposure to manufacturing, healthcare or consumer companies.
Market-cap exposure is also important.
A strategy focused primarily on large-cap companies may have a different risk and return profile from one with significant mid-cap or small-cap exposure.
Investors should therefore examine sector allocation, market-cap distribution and other relevant portfolio characteristics.
This can also reveal whether two apparently different PMS strategies actually have significant overlap in their holdings.
Compare Portfolio Turnover
Portfolio turnover indicates how frequently investments are bought and sold.
A strategy with high turnover may make frequent changes to its holdings, while a lower-turnover strategy may hold companies for longer periods.
Neither is automatically preferable.
A high-turnover strategy may be built around shorter-term opportunities or frequent changes in investment conviction. A lower-turnover strategy may be based on long-term ownership of businesses.
The important question is whether the turnover level is consistent with the stated investment philosophy.
Investors should also understand that frequent transactions can have implications for brokerage, taxes and other costs.
Look at How the Strategy Behaved in Different Market Conditions
A single market period may not tell the complete story.
Investors can examine how a PMS strategy behaved during rising markets, falling markets and periods of significant volatility.
For example, a strategy may have performed strongly during a bull market but experienced a much larger decline during a correction.
Another strategy may have delivered more moderate returns during rising markets while experiencing a smaller decline during difficult periods.
Looking at different market environments provides additional context around the strategy’s behaviour.
The purpose is not to identify a strategy that wins in every environment. Markets change, and a strategy designed for one investment philosophy may naturally behave differently from another.
Understand the Benchmark
A PMS return should not be viewed in isolation.
Investors should understand what benchmark the strategy uses and why that benchmark is appropriate.
A strategy focused on a particular segment of the equity market should ideally be evaluated against a relevant benchmark rather than an unrelated index.
The comparison can help investors understand whether the strategy has added value relative to the market exposure it is designed to provide.
It is also important to understand whether the reported performance and benchmark figures are being presented on a comparable basis.
Check the Performance Period
A PMS that has delivered strong returns over one year may look very different when viewed over a longer period.
Investors should examine multiple time periods where data is available.
This could include one-year, three-year, five-year or longer periods, depending on the strategy’s history.
Longer periods can provide more context, particularly for strategies designed around long-term investing.
At the same time, a longer track record does not automatically make a strategy suitable. The investment philosophy, portfolio construction and current management approach still need to be examined.
Understand the People Managing the Strategy
A PMS strategy is not simply a collection of stocks. It is also a process operated by people.
Investors can examine who is responsible for managing the strategy, their investment experience and how long the current team has been associated with the strategy.
This becomes particularly important when looking at historical performance.
If the people or investment process responsible for the historical track record have changed significantly, investors should understand that the past performance may not represent the current approach in exactly the same way.
The continuity of the investment process is therefore worth examining.
Compare Fees and Other Costs
Two strategies with similar gross returns can produce different investor outcomes because of differences in costs.
PMS agreements can involve management fees, performance-related fees and other applicable expenses depending on the structure.
Investors should understand exactly how the fee arrangement works.
For example, a performance-based fee can be structured differently from a fixed management fee. Investors should also understand whether there are additional costs associated with transactions, custody or other services.
Comparing returns without considering costs can create an incomplete picture.
The relevant number for an investor is ultimately the outcome after applicable expenses and taxes, subject to the specific circumstances of the investment.
Look at Portfolio Liquidity
Liquidity is another factor that can sometimes be overlooked.
A strategy investing primarily in highly liquid large-cap stocks may have a different liquidity profile from one investing significantly in smaller companies.
This can matter particularly during periods of market stress.
Investors should understand what types of securities the PMS typically owns and how easily those holdings can be bought or sold.
A portfolio’s liquidity can influence how quickly the manager can make changes and how the portfolio behaves when market conditions become difficult.
Understand the Investment Horizon
Different PMS strategies can be designed around different holding periods.
A long-term strategy may expect companies to compound over several years. Another strategy may actively respond to changing market opportunities.
Investors should therefore ask how long the manager typically expects to hold an investment and whether that matches their own investment horizon.
A mismatch can create unnecessary pressure.
For example, an investor expecting to withdraw capital in the short term may find it difficult to stay invested in a strategy designed around long-term business growth.
Examine the Actual Portfolio
One of the most useful things investors can do is look beyond the marketing material and examine the portfolio itself.
Which companies does the strategy own?
How much is allocated to each holding?
Which sectors dominate?
How concentrated is the portfolio?
How frequently does it change?
Are there significant similarities with another PMS strategy being considered?
The actual portfolio can reveal characteristics that a performance chart cannot.
It can also help investors determine whether they understand and are comfortable with the businesses and sectors they are indirectly exposed to.
Compare Process, Not Just Outcomes
Past returns are an outcome.
The investment process is what produced those outcomes.
When comparing two PMS strategies, investors can therefore examine how each manager researches companies, constructs the portfolio, determines position sizes and responds when an investment thesis changes.
A strong process does not guarantee strong future returns. However, understanding the process can help investors assess whether the strategy is coherent and whether they are comfortable with how decisions are made.
This is particularly important because market conditions change.
A strategy that performed well under one set of conditions may behave differently when the economic or market environment changes.
Build a More Complete Comparison
Instead of creating a comparison based on one number, investors can create a broader checklist.
Look at investment philosophy, historical performance, benchmark, drawdowns, volatility, concentration, sector allocation, market-cap exposure, portfolio turnover, liquidity, fees, management team and investment horizon.
This creates a more complete picture of what the two PMS strategies actually represent.
It also helps separate two questions that are often confused.
The first is: How has the strategy performed?
The second is: How does the strategy generate those returns?
Both matter.
Final Thoughts
Comparing PMS strategies solely on past returns can make a complicated investment decision look deceptively simple.
Returns provide useful information, but they are only one part of the picture.
Risk, drawdowns, concentration, portfolio construction, investment philosophy, fees, liquidity, management continuity and benchmark selection can all influence how an investor experiences a PMS strategy.
The right comparison is therefore not simply about finding the strategy with the highest historical return.
It is about understanding what each strategy owns, how it invests, what risks it takes, what it costs and whether its approach fits the investor’s own objectives and tolerance for risk.
Past performance can tell you what happened.
A deeper evaluation can help you understand how it happened.